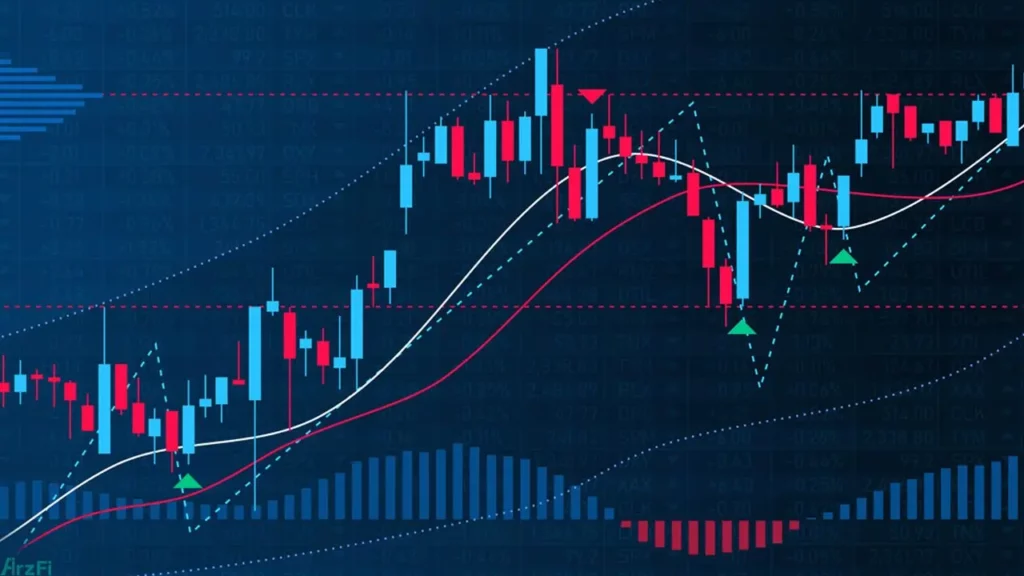
Using Leading and Lagging Indicators in Forex Technical Analysis
In the forex market, traders constantly seek suitable opportunities to buy and sell in order to maximize their profits. One popular method for identifying these opportunities is through technical analysis. This analysis uses tools and indicators that help traders analyze price movements and volume, allowing them to predict market trends.
Among these tools, leading and lagging indicators are essential components of technical analysis. Each has unique characteristics and applications, helping traders make informed decisions. In this article from Toofan Trade Academy, we explore these two types of indicators and how they can be used effectively in forex market analysis.
Leading Indicators in Forex
Leading indicators help traders make predictions about future market movements by analyzing past data. These indicators often appear before actual price changes, giving traders the chance to enter the market early in a trend.
Key Features of Leading Indicators
- Predicting Future Trends: Leading indicators are designed to provide signals before actual market trends form. These signals can indicate potential price changes, trend reversals, or trend continuations.
- High Sensitivity: These indicators are highly sensitive to small changes in the market and are generally suitable for short-term or swing trading strategies.
- Potential for False Signals: Due to their high sensitivity, leading indicators may produce false signals. Traders need to use them cautiously and often combine them with other tools.
Read more: What is hedging?
Types of Leading Indicators
- Relative Strength Index (RSI): RSI measures the strength of price movements and helps identify overbought or oversold conditions. It ranges from 0 to 100, with values above 70 indicating potential price reversals downward and values below 30 suggesting a possible upward reversal.
- Stochastic Oscillator: This leading indicator helps identify points where the price may reverse from its current trend. Like RSI, it ranges from 0 to 100 and works based on overbought and oversold levels.
- Moving Average Convergence Divergence (MACD): MACD is a popular leading indicator that uses two moving averages to provide buy and sell signals. Crossovers of these lines often indicate potential trade entries and exits.
Applications of Leading Indicators
Leading indicators are typically used for identifying short-term trading opportunities. Traders can quickly enter or exit the market based on these indicators’ signals. For instance, when RSI reaches overbought or oversold zones, it signals potential price reversals.
However, using leading indicators alone can sometimes lead to false signals. Therefore, combining them with other analytical tools can improve their effectiveness.

Lagging Indicators in Forex
In contrast to leading indicators, lagging indicators confirm previous trends. These indicators are based on historical market data and help traders validate whether a real trend has started.
Key Features of Lagging Indicators
- Confirming Past Trends: Lagging indicators are designed to confirm trends that have already formed, giving traders confidence that the current market trend is reliable.
- Higher Accuracy: Since these indicators rely on past data, they tend to produce fewer false signals compared to leading indicators.
- Delayed Signals: Lagging indicators typically provide signals with a delay. This might result in traders missing early entry opportunities.
Types of Lagging Indicators
- Simple Moving Average (SMA): SMA calculates the average of past prices over a specific period. When the price is above the SMA, it indicates an uptrend, and when below, it signals a downtrend.
- Exponential Moving Average (EMA): EMA is similar to SMA but gives more weight to recent price data. It is more sensitive to recent changes and can also confirm short-term trends.
- Bollinger Bands: Bollinger Bands consist of three lines: a middle moving average and two outer lines that represent market volatility. When the price reaches either the upper or lower bands, it can signal potential trend reversals.
Read more: Intermarket analysis and its effects on forex trading
Applications of Lagging Indicators
Lagging indicators are useful for confirming long-term and medium-term trends. For example, moving averages help traders verify if an uptrend or downtrend is strong and avoid reacting to minor market fluctuations.
Lagging indicators are especially beneficial for traders looking to profit from stable and sustained trends. They help traders avoid getting caught in small market movements and focus on stronger, more consistent trends.
Combining Leading and Lagging Indicators
Professional traders often combine both leading and lagging indicators instead of relying on just one. This combination allows traders to benefit from early signals provided by leading indicators while confirming the trend with lagging indicators.
For instance, a trader may use RSI (a leading indicator) to identify potential price reversals and then use a moving average (a lagging indicator) to confirm the trend. This strategy helps reduce false signals and ensures more accurate trade decisions.
Conclusion
Leading and lagging indicators are powerful tools in forex technical analysis that help traders make better decisions. Leading indicators offer early signals, allowing traders to enter trends at an early stage, while lagging indicators confirm existing trends, reducing risk and increasing confidence.
By combining these two types of indicators, especially for those looking to minimize risk and increase trade accuracy, traders can develop more robust trading strategies. By studying and using these tools correctly, traders can perform more precise analyses and identify profitable opportunities in the forex market.
